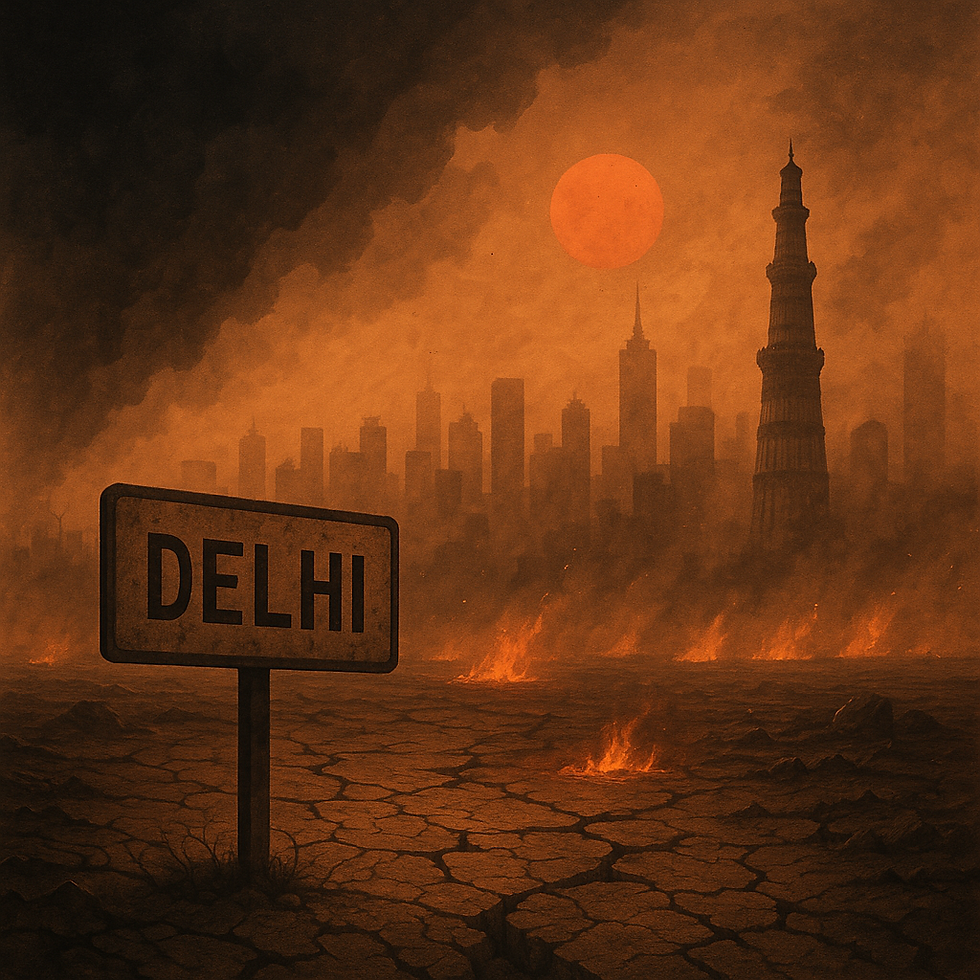
Delhi Beyond Limits: The Ecological Breaking Point of India’s Capital
- A. Falconer
- Jul 19, 2025
- 2 min read


🌆 Introduction
What if Delhi’s lungs stop breathing? With nearly 33 million residents, India’s capital is straining at its ecological seams. This post uncovers the data behind the crisis—and why urgent action is non-negotiable.
1. Air Pollution: Toxic Smog All Year Round
2024 average AQI: 209—Delhi’s worst in 5 years; no ‘good’ air days recorded UrbanEmissions.Info+5Press Information Bureau+5The Times of India+5.
Java spring relief: In 2024, Delhi logged its highest-ever number of "Good to Moderate" AQI days, yet overall pollution remained alarmingly high Press Information Bureau.
PM2.5 levels in 2016 peaked at 931 µg/m³, 186 times the WHO limit of 5 µg/m³ environment.delhi.gov.in+14Smart Air+14arXiv+14.
🔥 Visual suggestion: Embed dynamic heatmap of winter vs summer AQI, spotlighting hazardous inhalation hotspots.
2. Groundwater: Drained to the Brink
2023 extraction: 99.1% of recharge used—a red flag for sustainability Smart AirThe Times of India+2The Times of India+2The Times of India+2.
Recharge dropped from 0.41 bcm in 2022 to 0.38 bcm in 2023 The Times of India.
NRGTO data: 14 out of 34 districts are "over-exploited"; lowest levels reach ~67 m bgl The Times of India+10CGWB Data+10The Times of India+10.
💧 Visual idea: Layer district-wise map showing groundwater stress zones (e.g., red=critical).
3. Waste: Mountains of Methane Trash
Daily MSW (Municipal Solid Waste): ~11,300 tonnes The Times of IndiaThe Times of India+4ScienceDirect+4environment.delhi.gov.in+4.
Only ~7,300 tonnes/day processed—leading to 4,000 tonnes accumulating daily in landfills The Times of India.
Delhi-NCR combined waste ~14,000 tonnes/day; 3,000 tonnes/day remain untreated aaqr.org+7theprint.in+7The Times of India+7.
Landfill methane leaks: 124 emissions events since 2020; major threat from Ghazipur, Bhalswa, Okhla theguardian.com+1The Sun+1.
🌱 Visual plan: Animated landfill map showing waste-to-energy plants vs untreated dump zones.
4. Cumulative Impact: Crossing Multiple Ecological Boundaries
Dimension | Indicator | Status |
Atmosphere | AQI & PM2.5 levels | Critical |
Hydrosphere | Groundwater recharge vs use | Exhausted |
Geosphere | Waste volume & methane leaks | Overshoot |
5. Why It Matters: Health, Climate & Justice
Health costs: Life expectancy cut by ~12 years due to pollution CGWB Data+6Press Information Bureau+6The Times of India+6AlamyThe Sun.
Climate effect: Landfill methane is a potent greenhouse gas contributing to heatwaves and extreme weather.
Equity: Those living near dump sites face the brunt. Slum dwellers inhale smog; urban poor suffer from water scarcity.
6. How Delhi Can Start Breathing Again
🧩 Data-Driven Urban ESG Approaches
Continuous air quality sensors across seasons and districts.
Smart groundwater monitoring with district-level alerts.
Landfill gas capture + WTE expansion—current plans aim to process 15,000 tonnes/day by 2027 The Times of India.
🔍 Governance & Civic Action
Crackdown on illegal borewells—~16,000 sealed in 2025 The Times of India.
Community awareness drives, civic science efforts on monitoring and cleanup.
🔧 Tech & ESG Tools
Integrate AI & satellite data to forecast pollution spikes.
Use Falcon Research ESG dashboards to align city planning with ecological "guardrails"—e.g., pollution levels per district, recharge deficits, landfill emissions.
7. Conclusion: A Last Call to Live Within its Means
Delhi is already bursting at the seams of air, water, and waste. But with smarter data, hard governance, and urban ESG tools, we can start to translate ecological limits into actionable policies—and reclaim Delhi's future.


Comments